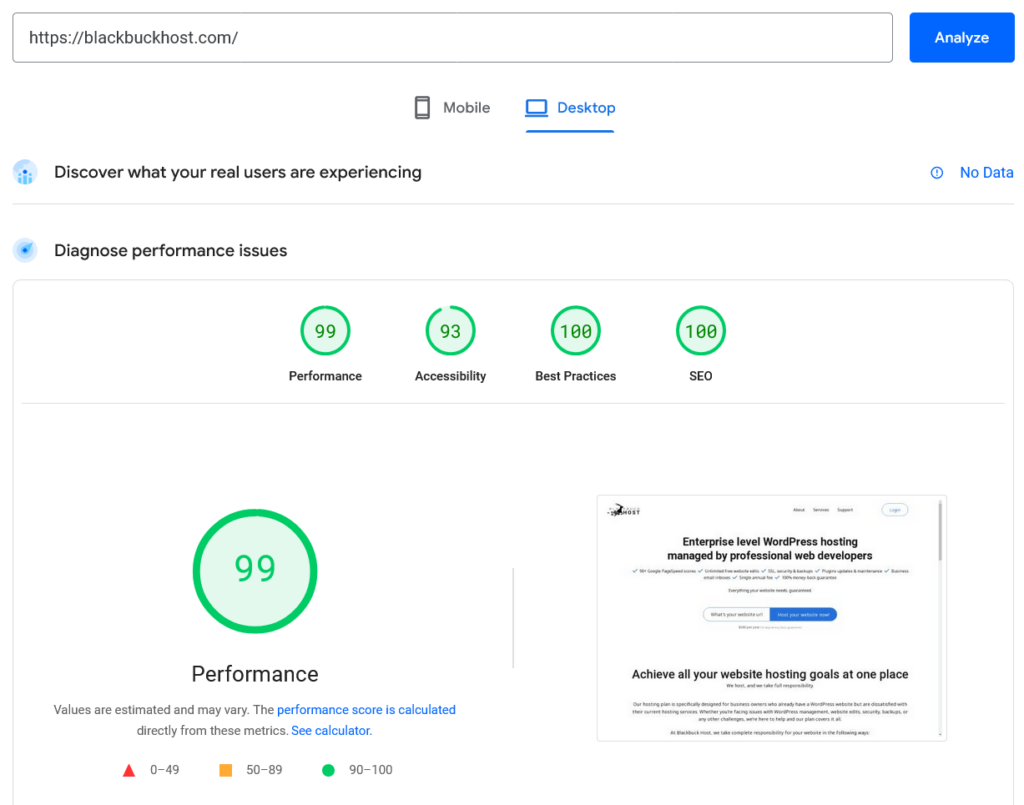
Google PageSpeed Insights is an essential tool for analyzing your website’s performance, providing detailed insights into how fast your site loads and what improvements can be made. Knowing how to check your PageSpeed scores can help you ensure your site delivers a great user experience, which is crucial for retaining visitors and improving your search engine rankings. Here’s a step-by-step guide on how to check your website’s Google PageSpeed scores.
Step 1: Visit the Google PageSpeed etool
To begin, open your web browser and navigate to the Google PageSpeed Insights tool. The URL for the tool is https://pagespeed.web.dev/. This is where you’ll be able to enter your website’s URL and receive a detailed performance analysis.
Step 2: Enter your website’s URL
Once you’re on the PageSpeed Insights page, you’ll see a text box where you can enter your website’s URL. Type or paste the full URL of the webpage you want to analyze. Make sure the URL is correct to get accurate results.
Step 3: Run the analysis
After entering your website’s URL, click the “Analyze” button. Google PageSpeed Insights will then start processing the request. This may take a few seconds as the tool evaluates various performance metrics.

Step 4: Review the overall score
When the analysis is complete, the tool will display an overall score for your website. The score is divided into two categories: Mobile and Desktop. The score ranges from 0 to 100, with higher scores indicating better performance. Typically, a score above 90 is considered excellent, while a score between 50 and 89 indicates room for improvement.
Step 5: Examine the detailed report
Below the overall score, you’ll find a detailed report that breaks down your website’s performance into various metrics, such as First Contentful Paint (FCP), Largest Contentful Paint (LCP), and Cumulative Layout Shift (CLS). Each metric is color-coded—green indicates good performance, yellow indicates moderate performance, and red indicates poor performance.
Step 6: Check the opportunities and diagnostics
Scroll down further to see sections labeled “Opportunities” and “Diagnostics.” The Opportunities section provides suggestions for improving your website’s load speed, such as optimizing images or reducing unused CSS. The Diagnostics section offers additional information on how your website adheres to best practices, including recommendations for further enhancements.
Step 7: View the passed audits
At the bottom of the report, you’ll find a list of “Passed Audits,” which highlights the areas where your website is performing well. These are elements of your site that meet Google’s standards for performance and don’t require any immediate changes.
Step 8: Save or share the report
If you want to keep a record of the analysis or share it with a developer, you can easily download the report or share the link directly. There’s an option to download the full report as a PDF, which can be useful for reviewing later or for sending to your team for further action.
By following these steps, you can quickly and easily check your website’s Google PageSpeed scores. Regularly monitoring these scores is crucial for maintaining a fast, user-friendly website. Whether you’re managing a personal blog or a large e-commerce site, understanding how your site performs can provide valuable insights into where improvements can be made. However, keep in mind that the report is a diagnostic tool, and addressing the issues identified will require additional steps and possibly the assistance of a developer.
Remember, this guide is purely for checking your Google PageSpeed scores. For solutions and improvements, you’ll need to delve deeper into the specific recommendations provided by the tool.
